Figure 8
From: Effect of exercise on chemically-induced colitis in adiponectin deficient mice

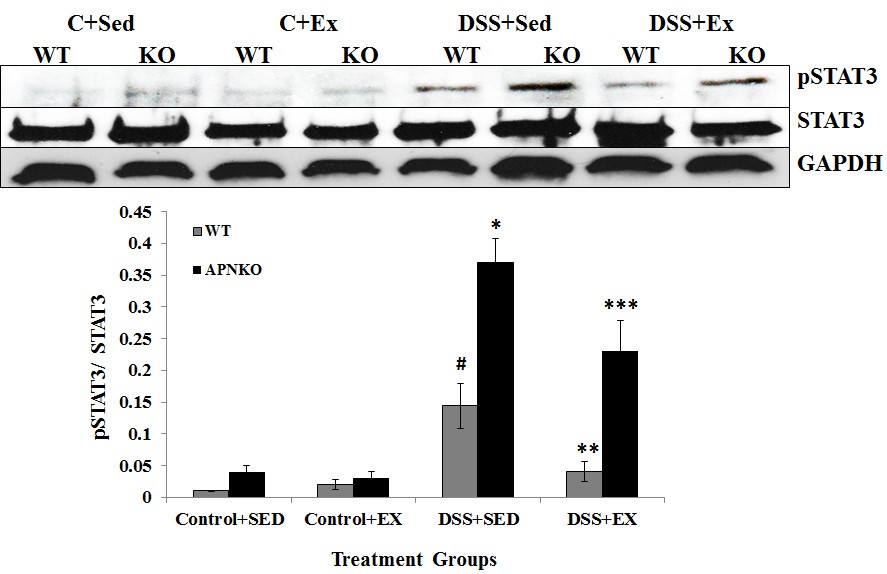
Western blot analysis of pSTAT3, STAT3 and GAPDH expression. (A) Representative Western blot image for the expression levels of pSTAT3, STAT3 and GAPDH. (B) Graph showing the ratio of the relative density of pSTAT3 and STAT3 protein expression and normalized with GAPDH. One way ANOVA was used to calculate the significant difference between the relative mean density of pSTAT3 protein expression. # vs * p < 0.04, ** vs *** p < 0.03, # vs ** and * vs *** p < 0.05.